Work · Case study
Risk management platform: making complex data manageable
A decision tool for large programmes, where every number on screen is money or time.
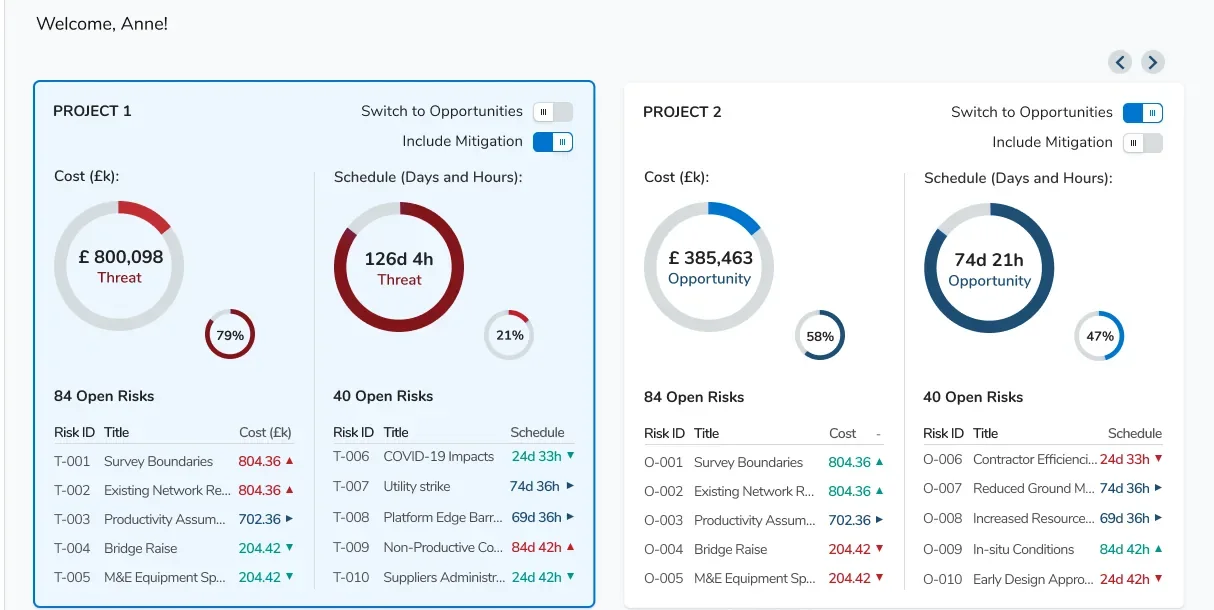
- Role
- UX Designer
- Product
- B2B SaaS, web
- Users
- Risk managers, project directors, risk owners, admins
- Focus
- Dashboard, record wizard, registers, access roles
- Tools
- Figma
Context
A platform where teams record risks, measure their cost and schedule exposure and decide where to act. It was first built for construction programmes, with a structure that can grow to other sectors.
How work is organised
- Organisation
- Programme
- Project
- Work package
- Risks
- Assumptions
- Issues
- Lessons learned
The challenge
Dense data
Many projects, hundreds of risks and tables with ten or more columns.
Long, conditional forms
One risk needs details, causes, consequences, actions and an optional analysis.
Many record types
Risks, issues, assumptions and lessons learned share one logic but not one form.
Experts and newcomers
Power users need speed, and new users need to start without training.
How I worked
In the team
Worked in sprints with developers and handed over screens and flows story by story.
With stakeholders
I had no direct access to end users, so decisions were reviewed with stakeholders and domain experts.
What I delivered
Numbered flows, high-fidelity screens in every state, a style guide, and tablet and large-screen views.
One wizard for every record
Instead of one long form, adding a record is a five-step wizard. Each step asks for one kind of information, and the same pattern serves risks, issues, assumptions and lessons learned, with fewer steps where a record type needs fewer.
The last step, an advanced analysis, is optional: experts can use it and everyone else can skip it.
Add risk
- Risk details
- Causes
- Consequences
- Actions
- Monte Carlo
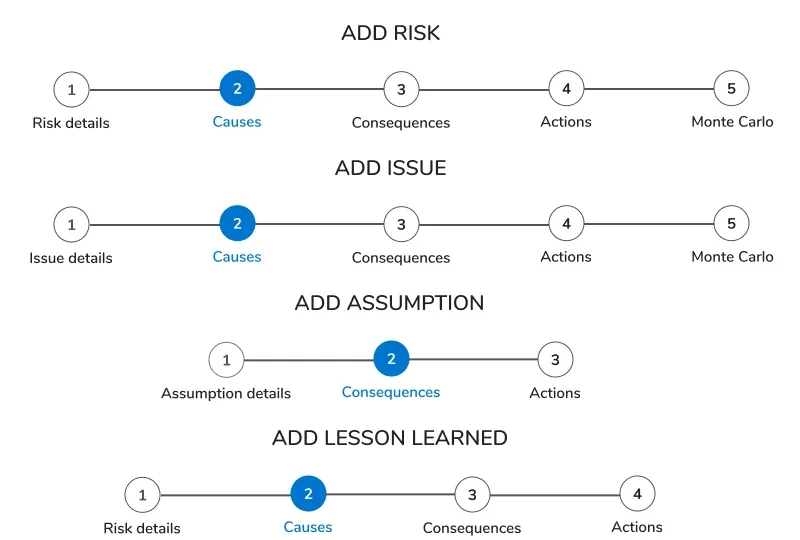 One stepper for every record type
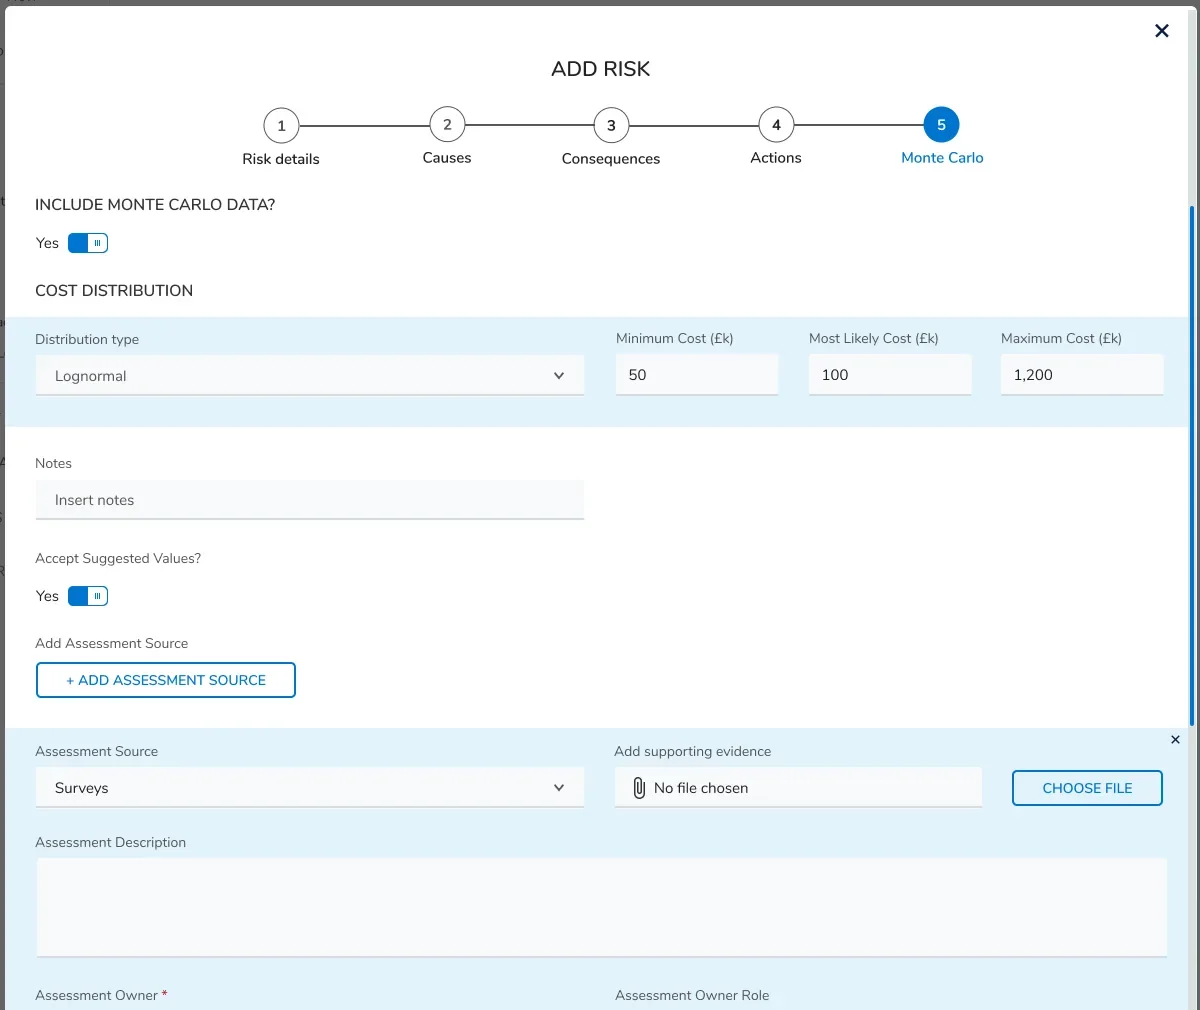 The optional analysis step
Key decisions
A dashboard readable in five seconds
The first screen shows where the exposure is and what needs attention, before any table.
Range sliders with labelled bands
Likelihood and impact are chosen on a slider whose bands have names, which removes guesswork for non-specialists.
Registers people can shape
Users choose and order their columns, so the same dense table works for different roles.
Two access roles
Full access and Read-only, each scoped by programmes and projects.
 Exposure by category: the value and its share in one bar
Style guide
A style guide kept the product consistent across sprints and screen sizes. Buttons are 42px high with a 5px radius and a minimum width of 100px. The affirmative action sits on the right and the dismissive one on the left.
- Primary blue#0074D0
- Dark blue#1E4E74
- Red#C01F28
- Light blue#E1F1FB
- Green#009688
 Buttons in four states
What I would improve today
- Make the first wizard step shorter by moving categorisation fields into an optional, collapsed section.
- Autosave a draft at every step, so nobody loses work.
- Add plain-language hints for terms such as likelihood bands and Monte Carlo.
- Run an accessibility pass: contrast on grey fields and small labels, and text next to every colour.
- Set sensible default columns per role.
- Test with real users and measure time to log a risk, errors per form and drop-off.
A note on screens
This work is under NDA, so the client name, logo and most screens are not shown. I am happy to walk through the flows and decisions in an interview.
Let's work together
Let's work on something together
Tell me about your project or role. A few lines about the product, the goal and the timeline is enough to start the conversation.